I don’t know what stock prices will do in the future. No one does.
For quite a while, stock prices have seemed quite high to me. In the last year, what seemed already high has gone even higher. Most investors seem quite optimistic that publicly traded companies earnings will dramatically increase in the coming years.
This isn’t just a hunch or a feeling that I have. You can objectively measure how optimistic investors are by dividing the price of a share of stock by the earnings attributed to that share of stock. This gives you the Price/Earnings or PE ratio. For profitable companies, the PE ratio tells you how many dollars investors are willing to pay for $1 dollar of earnings from a particular company.
Take Amazon (AMZN) for example. Yesterday at 4 PM, the price of one share of Amazon was $1,204.20. Over the last 12 months, that share entitled you to $3.92 of Amazon’s earnings. Amazon’s PE ratio is 307. That’s right. If you bought one share of Amazon at that price, you’d have paid $307 dollars for every dollar of AMZN earnings that is attributable to your share.
At the other end of the spectrum, a share of LG Display Co. (LPL) could have been purchased for $14.48. LPL makes those gorgeous OLED TVs that you see for sale at Best Buy. LPL earned $3.32 per share last year for a PE of 4.36.
You saw that right too. A dollar of LPL earnings costs $4.36 while a dollar of AMZN earnings costs $307. A dollar is a dollar. Why would anyone pay so much for a dollar of AMZN earnings when they could buy a dollar of LPL earnings for so much cheaper?
The answer is optimism. Stock analysts forecast that LPL will earn $1.64 per share in 2018. Half of what it earned over the last twelve months. AMZN is forecast to earn $8.03 in 2018 – more than double what it earned over the last twelve months.
Earnings at individual companies can be very bumpy depending on the economy and their individual circumstances, but the PE ratio gives us a very reliable guide to what other investors expect from a company. A high PE ratio means that they are optimistic that earnings will improve and a low PE ratio means that investors see the future of a company in more gloomy terms. Those expectations may prove correct or mistaken, but if we know the PE ratio, we have very good idea of how optimistic investors are feeling.
Just as you can calculate the PE ratio for an individual company, you can calculate the PE ratio of an index made up of individual companies. Take the S&P 500 Index of the 500 largest companies in the United States. Yesterday, it reached a record high of 2,714.37. Over the last twelve months, a “share” of the companies comprising the index would have earned $104.02 for an aggregate trailing-twelve-months PE of 26. That’s a lot more optimistic than LPL, but nearly as optimistic as AMZN.
There is a problem with PE ratios. The problem is the E (or earnings). Earnings are very dependent on the estimated values of a company’s assets. While all public companies use a common set of accounting standards when estimating their earnings, those standards still require many judgment calls and can result in significantly different earnings estimates depending on how they are applied.
Even when applied honestly and in good faith, the value of assets can be dramatically overestimated when times are good. When economic problems appear, the value of those assets is dramatically written down causing a company to report losses or dramatically reduced earnings. In truth, those assets were never as valuable as they appeared during good times (and may be more valuable than they appear during bad times). This causes earnings to be overstated during economic expansions and understated during economic recessions.
So if you are looking solely at Price divided by Earnings over the last 12 months, the PE is going to look lower than it should during expansions and higher than it should during recessions. To try to eliminate the noise created by fluctuations in the economic cycle, Yale economist Robert Shiller created the Cyclically Adjusted PE ratio or CAPE. CAPE divides the current price of a stock index by the average earnings of a “share” in that index over last ten years.
Today, the S&P 500 CAPE sits at 33.04. What does that mean? Are investors more optimistic or less optimistic than they have been in the past?
Here’s a graph of the CAPE since 1880 created by multpl.com:
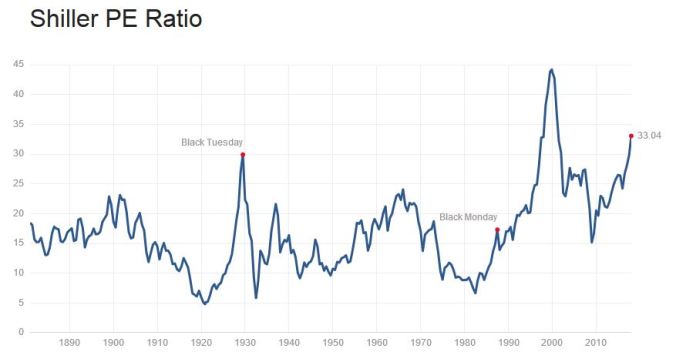
As measured by CAPE, investors are really optimistic. They are more optimistic than at any time in history including the Roaring Twenties which collapsed on Black Tuesday into the Great Depression. With one exception. At the height of the internet bubble, CAPE peaked at 44.19.
The mean CAPE value since 1880, has been 16.8. The S&P 500 would have to fall by half to reach that value. CAPE rarely sits at the mean; however. It tends to way overshoot the mean on the way up and way undershoot the mean on the way down. If CAPE dropped to 7 or 8, the stock market could lose 75 percent of its value.
Does that mean that the stock market is about to crater? No. No one knows the future. If stock prices shot up by another third, CAPE still would only be at the level that it was at the peak of the internet bubble. There’s no law that says it couldn’t exceed that peak. Irrational exuberance is, by definition, irrational.
Should you sell? Well, trying to time the market has been shown time and time again to be a fool’s game. Even the great Warren Buffet says he isn’t smart enough to do it successfully. It’s very unlikely that you or I have investing skills that exceed Warren Buffet’s. Buying index funds and holding them for 40 years is the only proven way to financial security in your old age.
Buy and hold though is easier said than done. When the S&P 500 went from 1570 in October of 2007 to 670 in March 2009, a 57 percent drop, there were very few people (including most professional investors) who could resist the temptation to sell and preserve what they had remaining of their net worth. If you are one of those people, you should take a bow. You are a rare bird indeed. (Note: There are many more people who sold in March 2009 than will admit selling in March 2009).
Wouldn’t it be nice if there were some way to insure yourself against losses in the stock market without actually selling your stocks? There is, but it comes at a price.
