Yesterday, we talked about investor optimism and how it can be measured in Price/Earnings or PE ratios. We also discussed the application of PE ratios to stock indices such as the S&P 500 and the use of a cyclically adjusted PE ratio (CAPE) to try to measure how optimistic investors are today about stock prices relative to the past.
The upshot is that investors are very, very optimistic. With the exception of the internet bubble, investors today are more optimistic that earnings from publicly traded companies will increase than they’ve been in 137 years. So much optimism makes me fearful that we may be in bubble where investors have thrown aside their fears and bid up the prices of stock market assets without regard to their underlying value or the risks of economic misfortune. Their only fear seems to be the fear of missing out.
One option when you think the stock market it caught up in bubble psychology is to just sell your stock market investments and wait for prices to retreat. Experience tells us though that trying to time the market is very rarely successful. Even investing giants such as Warren Buffet admit that they aren’t able to do it.
An alternative is to buy insurance that protects you against the risk of stock market losses while allowing you to reap gains should the stock market continue to increase. This kind of insurance is called a PUT. A PUT gives you the right (but not the obligation) to sell a stock or other security in the future at a given price.
SPY is an exchange traded fund that replicates the S&P 500 Index. One share of SPY is equal to 1/10th of the S&P 500. As I write this, one share of SPY is trading at $272.69. For $2.44, you can buy a PUT that gives you the right to sell that share of SPY on February 16, 2018 for $272. You pay a small premium and if SPY declines in value between now and February 16, your losses are limited to 69 cents. If SPY increases in value, you get to keep the gains (and person who sold you the PUT gets to keep their premium so everyone wins).
OK, that protects you for six weeks, but what about longer periods? You can also buy long term PUTS called leaps. As I write this, you can buy for $20.67 a leap PUT that gives the right to sell your SPY shares for $270 on January 17, 2020. That will protect for you two years, but $20.67 is a pretty steep premium.
And that leads to the crux of the problem. How do you know what is a reasonable price to pay for insurance? $20.67 is 7.6 percent of the current value of SPY. Is that a lot to pay for two years of insurance? Over the very long term, the S&P 500 Index average annual retun is about 7.5 percent. So the price for two years of insurance is roughly one year of gains. That doesn’t sound like a great deal.
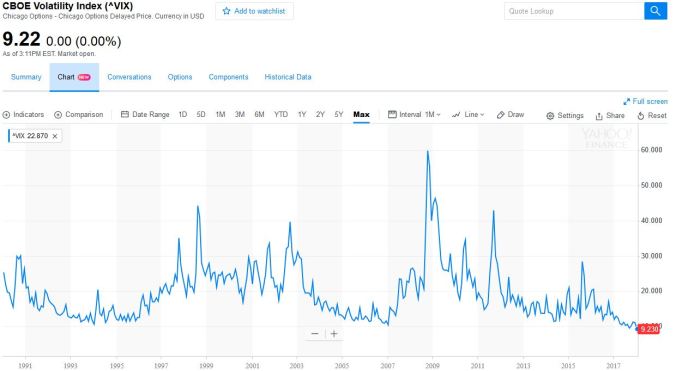
One approach to thinking about the cost of insurance, is to look at what it has cost historically. In January 1990, the Chicago Board of Options Exchange created an index that measures the cost of options to insure against unforeseen changes in the S&P 500 Index. It’s called the Volatility Index or VIX. You will also see it jokingly called the “Fear Index.” Here’s a chart of VIX since it’s inception in 1990.
One of the wonderful things about stock market bubbles is that for them to happen, there must be almost universal optimism about the future and very little sense that the future might be risky. Investors become convinced that future profits are almost guaranteed and that future losses are very, very unlikely. The values of stocks skyrocket higher and higher and the cost of insuring against stock market losses goes lower and lower. As the bubble grows and gains pile up, selling insurance against losses begins to look like free money and more and more speculators begin selling insurance driving its cost down.
As you can see from the VIX chart, in late 2007 when SPY was setting record highs, the cost of insurance against losses in SPY was approaching record lows. Conversely in late 2009, when SPY was already well on its way to 670 is when the cost of insurance against losses in the SPY as measured by VIX became very, very expensive.
If the S&P 500 drops by 45 percent or more, having spent 7.6% of your investment to avoid those losses is going to seem like a fantastic deal. Still that’s a lot of money and no one, especially folks like you and me, knows if that insurance is actually going to be needed. I don’t know the future and stocks could continue to advance from these very elevated levels in spite of my fears.
Fortunately, there’s another option and it’s one that suits my personal risk tolerance much better. The way I think about insurance is not really as protection against deep, but temporary losses in the stock market. If you buy and hold over the very long term, it is very likely that you will recoup those losses and reap generous gains as well. You are really insuring yourself against the overwhelming psychological pressures that arise to sell your holdings as losses deepen and deepen and then deepen some more.
Experience shows that most stock market investors can withstand a twenty percent decline in their holdings relatively well. It’s not until losses are greater than twenty percent that fear starts to feed on itself and more and more investors start selling their investments to ensure that they have something left “just in case”.
At the height of the 2008 financial crisis, very sane, very rational people (Henry Paulson and Ben Bernanke to name a few) were talking about a new Great Depression and possible end to civilization unless the government intervened in unprecedented ways to prevent the crisis from spreading further. When Obama was sworn in as President, the GDP was falling at 9 percent annualized rate. That’s why the S&P 500 fell from 1570 to 670 during that time. Stock market investors were not imagining the problems that faced our economy. It really felt as though there was a non-zero possibility of a new dark age beginning. In those circumstances, it is very, very hard resist the temptation to sell your stock market investments and move them into something safer.
If you are insuring yourself against the temptation to panic and sell your investments at the bottom, why not buy an SPY PUT that gives you the right to sell your shares for $220 instead of $270? That will ensure that you are protected should stock prices fall into the “panic zone”, but surely at much lower premium.
And, in fact that’s right. As I write this, you can buy a 220 SPY PUT option expiring on January 17, 2020 for $8.18 or 3 percent of the value of one share of SPY. The dividends that your share of SPY will pay over the next two years will more than cover the cost of your insurance premium. And your insurance will ensure that even should the worst happen, you will still be able to lock in your stock market gains at a valuation that is well above what CAPE ratios suggest are historically reasonable.
Warren Buffet advises investors to “Be fearful when others are greedy and greedy when others are fearful.” With CAPE ratios very high and the fear index very low, I’ve personally decided that now a good time to buy insurance (at historically cheap prices) so that I’m protected should a disaster befall us between now and January 2020.
Only you can decide what course of action is appropriate for you, but I’d encourage all of you to think carefully about risk, reward, and the cost of insurance.

Maybe we can start a betting pool as to when the next crash will be. I know one can’t predict but… I say in 2-3 years, so this PUT idea seems worth considering. After all, in the years since the 2008 crash, not many of the crucial reforms that were supposed to take place were implemented, and perhaps what was implemented are in the process of being reversed.
Back in 2011, there was this study that showed that the top 147 of corporations form a kind of super-entity that controls 40% of the wealth. This super-entity is so called because they are so financially interconnected with each other that they have created a system which mathematically resembles other such systems that are known to be unstable and vulnerable to collapse. If one fails, they all have a problem, and thus the world has a problem.
Next collapse, maybe it’s better to not bail them out with the people’s money. They have no interest in reform, we have seen, and have prevented it thus far. It seems better that this super corporation is broken up, though I fear what the result of the next financial collapse will be.
https://www.newscientist.com/article/mg21228354.500-revealed–the-capitalist-network-that-runs-the-world/
LikeLike
This is an interesting article. Thanks for the link. I think some of the conclusions of the study’s authors may be a little overdrawn. And the second half of the article points out some of those issues. Vanguard (No. 8 on the list of TNCs) for example is a co-op owned by its investors. It has these massive index mutual funds with hundreds of billions of dollars in assets, but those funds don’t really borrow money or control the assets, they are more like passive custodians for the folks who own the shares of the mutual funds.
OTOH, the authors of the study are right that that having huge companies that are financially interconnected can be a huge problem. Especially if those interconnections take the form of debt. And if there is a high level of debt/leverage in the overall system. AIG had sold a lot of insurance against bond defaults to banks and other financial institutions. When those bonds began to default, it didn’t have sufficient reserves to pay out its insurance claims so the banks that had bought insurance were suddenly vulnerable as well. Once they started to wobble, all of the banks customers began to get nervous because they weren’t sure that they could get their money back from Goldman Sachs if GS failed. And on it goes.
I think that raising the minimum equity requirements at banks will do a lot to lower the overall risk in the system. If you want to really get into the weeds on this stuff, the Volatility Lab at NYU’s Stern School of Business tries to quantify things like systemic risk. I have mixed feelings about how successful they are, but they have some tools that are fun to play around with that make pretty charts and maps:
https://vlab.stern.nyu.edu/
LikeLike